
What is HSI?
Introduction
Seeing beyond the visible
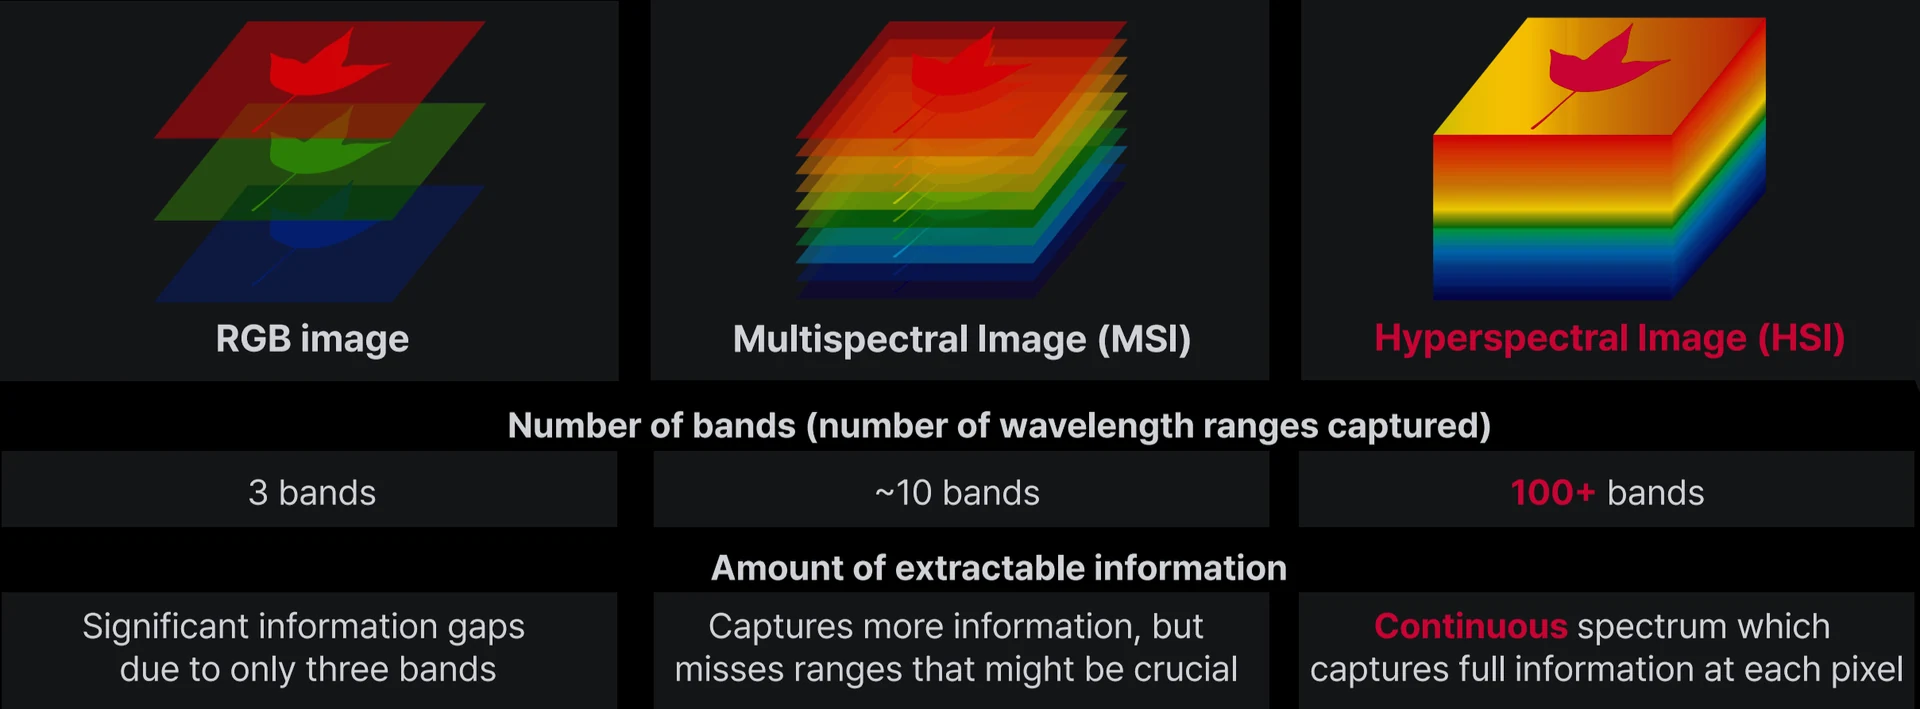
Our eyes see the world in just three broad colors — red, green, and blue.
Hyperspectral imaging (HSI) breaks light down into hundreds of narrow, continuous bands, revealing hidden details invisible to the naked eye.
The Science
The spectral fingerprint
Just as each person has a unique fingerprint, every material on Earth interacts with light uniquely — some wavelengths are absorbed, others reflected. By measuring spectral reflectance across hundreds of wavelengths, HSI creates a unique signature for any object, identifying materials without physical contact.
Toggle the materials below to compare their spectral signatures across the visible and near-infrared range.
* Curves smoothed for illustration. Shapes derived from foundational concepts in “Introduction to Hyperspectral Imaging” (MicroImages, Inc.).
| Wavelength (nm) | Clear Water | Dry Soil | Healthy Vegetation | Dry Vegetation | Concrete (Artificial) |
|---|---|---|---|---|---|
| 400 | 7 | 10 | 4 | 8 | 22 |
| 500 | 7.2 | 14.8 | 10.5 | 16.5 | 27.5 |
| 600 | 4.2 | 19.8 | 7.5 | 25.5 | 30.9 |
| 700 | 1.6 | 24.4 | 8 | 32.5 | 32.8 |
| 800 | 0.55 | 28.3 | 50 | 39.5 | 33.8 |
| 900 | 0.3 | 31.6 | 50 | 41.5 | 34 |
| 1000 | 0.3 | 34.2 | 47.2 | 38.5 | 33.6 |
Applications
Real-world applications
HSI provides continuous spectral data for every pixel, transforming cameras into powerful chemical sensors — technology that has moved from satellite-only research into commercial industries.
-
Precision Agriculture
Monitors crop health at a chemical level before human eyes can detect issues — identifying nutrient deficiencies, water stress, and early disease onset for targeted treatment.
-
Mineral & Resource Exploration
Airborne HSI maps large geographic areas to identify mineral deposits by how sunlight reflects off the Earth's surface — heavily used in mining and geology.
-
Medical Imaging
Non-invasive, label-free tissue analysis. Surgeons differentiate healthy tissue from tumor margins in real time by analyzing oxygenation and cellular signatures.
-
Environmental Monitoring
Tracks pollution spills and ocean algae blooms, and measures atmospheric scattering and absorption for air-quality and climate indicators.